Expert lower pane tabs
Additional information is provided in the nested tabs for a row selected in the upper panes of the Expert views.
Details tab
The Details tab contains additional details for a single flow or a single pair of nodes selected in the upper pane, identified as Client and Server.
For complete descriptions of the items in the Node details tab, see Expert node details tab rows and columns.
TIP: Set the units for throughput in the Expert View Options dialog. See Expert view options dialog.
Event Summary tab
The Event Summary tab shows the number of times each type of event was encountered. The header shows the Total number of events identified. The Event Summary columns are described below.
• Layer: The network layer to which events of this type belong.
• Event: The EventFinder event definition which identified this packet as an event (for example, TCP Retransmission).
• Count: The number of events of this type observed so far.
• First Time: The date and time of the first time the event of this type was observed.
• Last Time: The date and time of the last time the event of this type was observed.
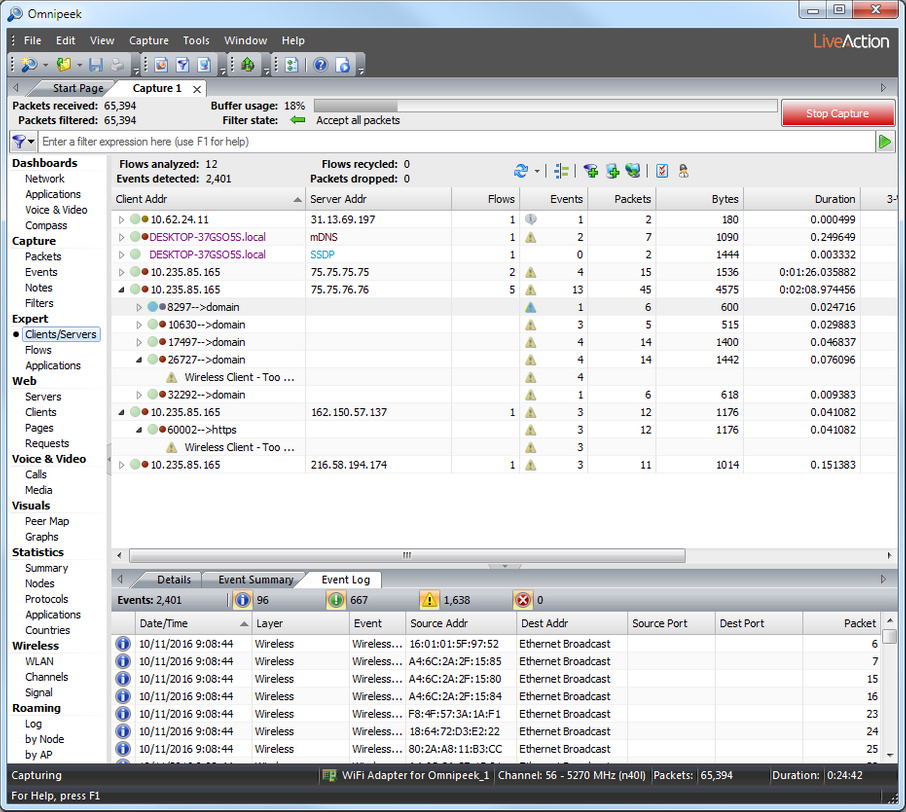
Event Log tab
The Event Log tab shows a count of total Messages in the log, and counts of events classified by their level of severity. These counts are shown beside the icon for that severity level (Informational, Minor, Major, and Severe).
Click the buttons associated with each level of severity to toggle the display of events.
NOTE: The counts will continue to update, even if you choose not to display events of a particular severity.
The Event Log can display up to 50,000 entries, subject to the limits you established in the Memory Usage section of the Expert EventFinder. See Expert memory usage.
For a complete list and description of the information available in each of the columns, see Expert event log columns.